Road Quality Analysis
During my 3rd year at PES university, I began working on a side project to help ameliorate the terrible state of roads in my home city.
The idea was simple, leverage the existing infrastructure of taxis services like Uber and Ola to collect accelerometric, gyroscopic and location data from on-board mobile devices. Then we could use this data to flag potholes and poor quality roads.
To achieve this, I built an app that could collect sensor and location data from a device into a time-series dataset, and then set out to drive around and collect data. After a couple hours of driving had collected enough data to test my theory.
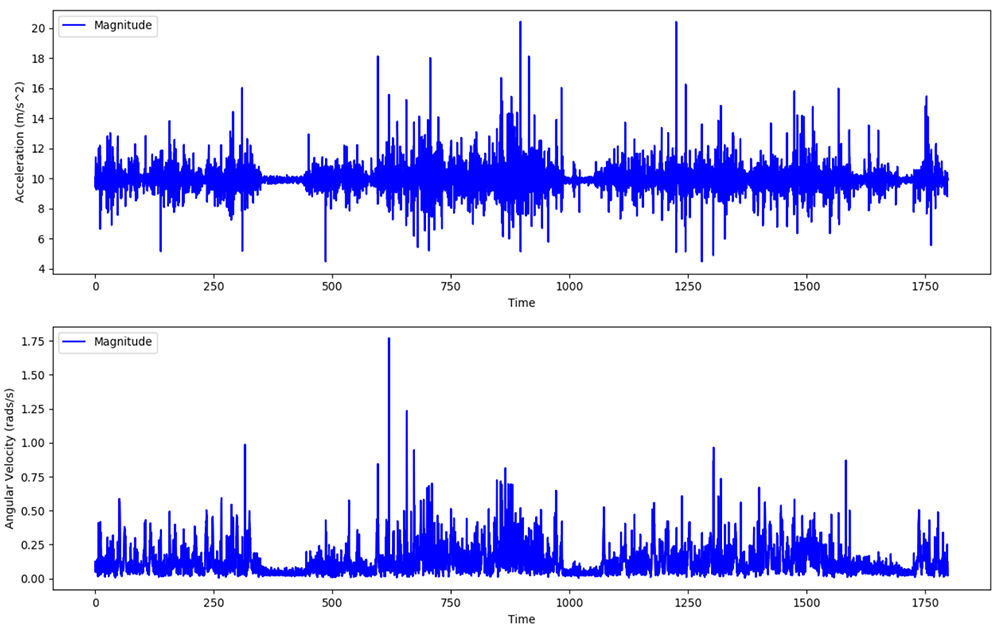
I normalized and applied a high-pass filter to the data, to select only anomalously data samples from the set. I then used K-means clustering to see if any patterns emerged.
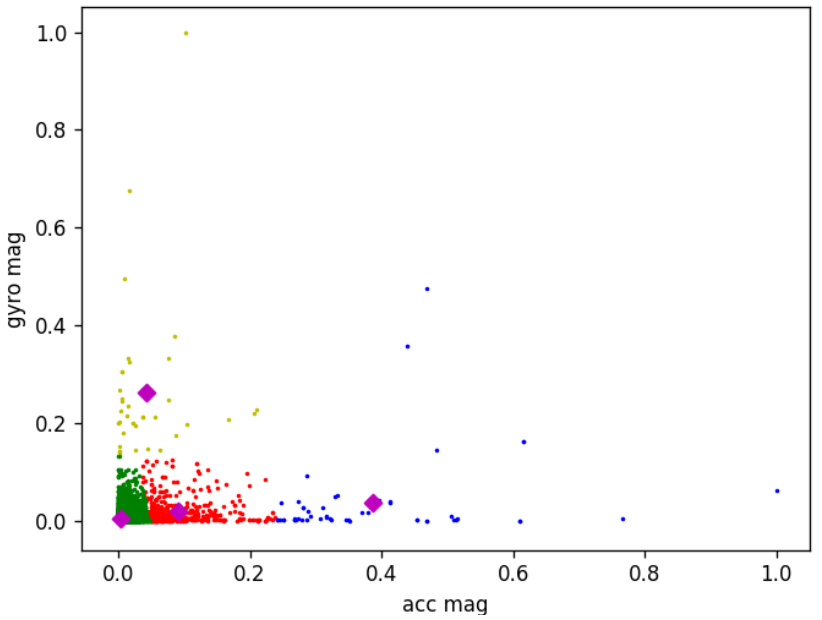
After, I plotted the resulting clusters to create a heat map for each cluster. The clusters could approximately group roads into Smooth Roads, Slightly rough roads, potholes/very rough roads and turning junctions/speed bumps.
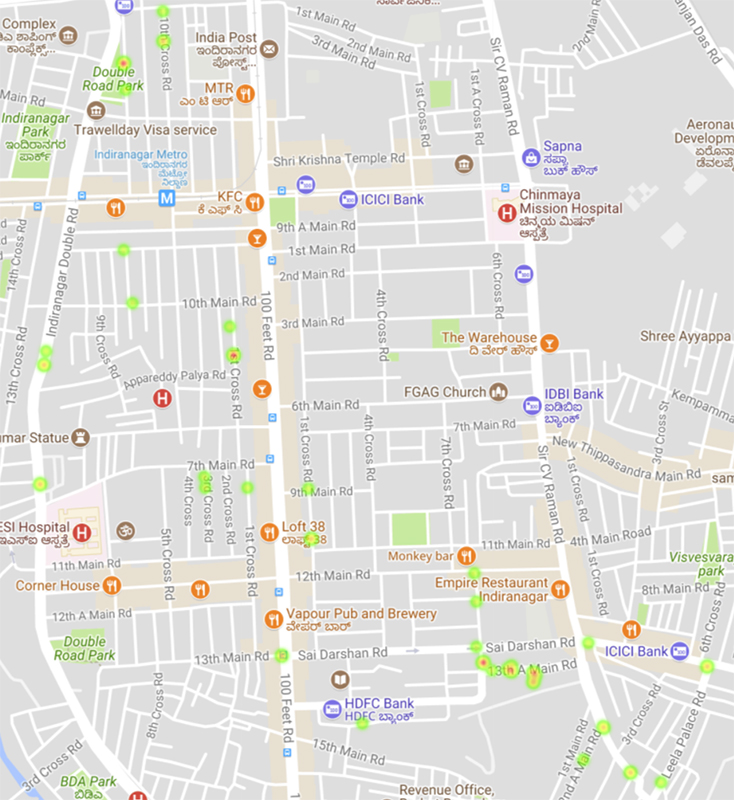
While these results heavily depend on the driver’s actions in each scenario, it shows promising results as a means to crowdsource the process of auditing road quality in cities.
Full Presentation
![]()